


The NAIOP CRE Sentiment Index
The NAIOP Sentiment Index is designed to predict general conditions in the commercial real estate industry over the next 12 months by asking industry professionals to predict conditions for their own projects and markets.
The NAIOP CRE Sentiment Index
Industry Leaders’ Outlook for Commercial Real Estate
The NAIOP Sentiment Index is designed to predict general conditions in the commercial real estate industry over the next 12 months by asking industry professionals to predict conditions for their own projects and markets.
Download the ReportKey Findings
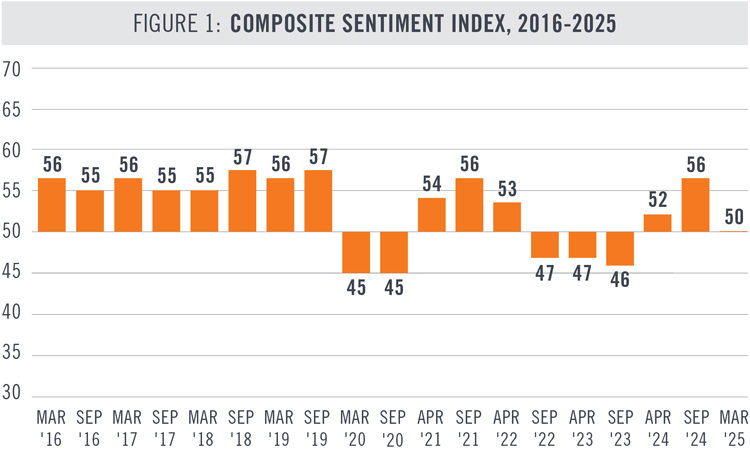
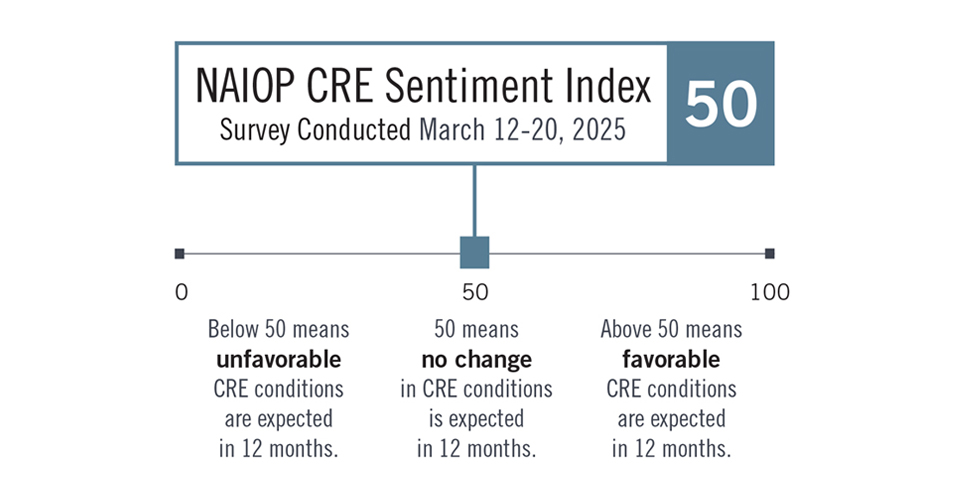
The NAIOP CRE Sentiment Index for March 2025 is 50, a decrease from the September 2024 reading, indicating that on balance, respondents expect conditions for commercial real estate to remain stable over the next 12 months (see Figure 1). The survey was conducted from March 12 to March 20, before the announcement of new tariff rates on April 2.
Future expectations for construction material and labor costs have sharply deteriorated. In open-ended comments, many respondents expressed concern about the effect that tariffs will have on the cost of construction materials. Expectations for more restrictive enforcement of immigration laws may similarly be contributing to concerns about future labor costs.
Respondents are slightly more optimistic about occupancy rates and rents than they were in September. These were the only variables used in the calculation of the Sentiment Index to show improvement over the results of the September survey. Open-ended comments suggest a range of opinions on the operational performance of industrial, office, retail and multifamily real estate.
They are somewhat less optimistic about capital market conditions. Respondents’ outlook for the availability of equity and debt, as well as the direction of cap rates, has deteriorated somewhat since the fall but remains generally optimistic. A decline in optimism about capital markets is unsurprising given the increase in long-term interest rates since last fall.
Although respondents are less optimistic about conditions over the next 12 months, developers and building owners still plan to increase investment. These respondents still expect transaction volumes to increase at nearly the same rate (score of 57) as in the September survey (score of 58). Open-ended comments suggest that more deal volume will be concentrated in existing buildings than in ground-up development. Not everyone is deploying capital, however, and several respondents indicated in comments that they are waiting on the sidelines due to uncertainty about the direction of the economy.
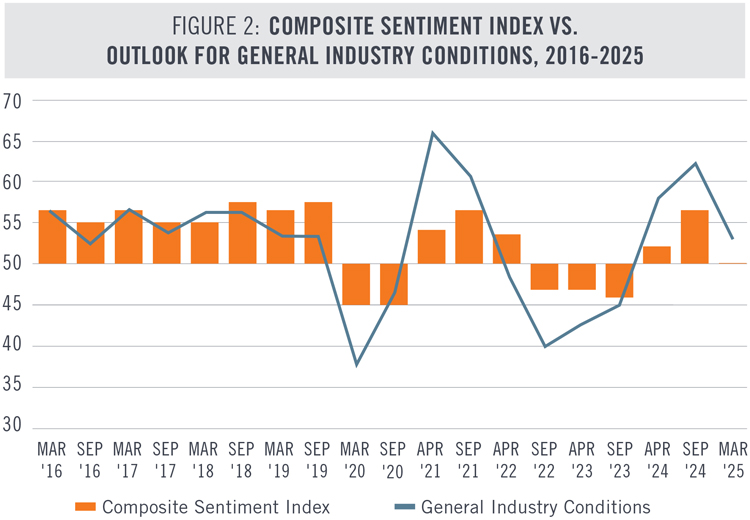
Respondents expect general industry conditions to improve somewhat over the next 12 months. The score for general industry conditions (53) is calculated separately from the CRE Sentiment Index. A higher score than the Index may be attributable to expectations for economic growth, which is not included in the calculation of the Index. When asked separately from the questions that comprise the Index, developers and building owners indicated they expect somewhat favorable local economic conditions over the next 12 months.
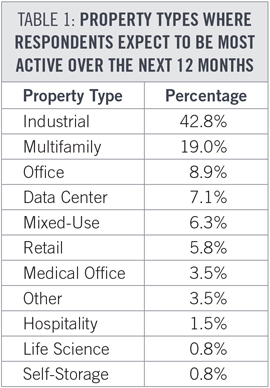
Most respondents expect to be most active in either industrial or multifamily real estate during the next 12 months (see Table 1). Office and data center properties attract the next highest levels of interest. More respondents indicated they plan to be active primarily in industrial and office properties than was the case in September.
Notable Changes in the March 2025 Survey
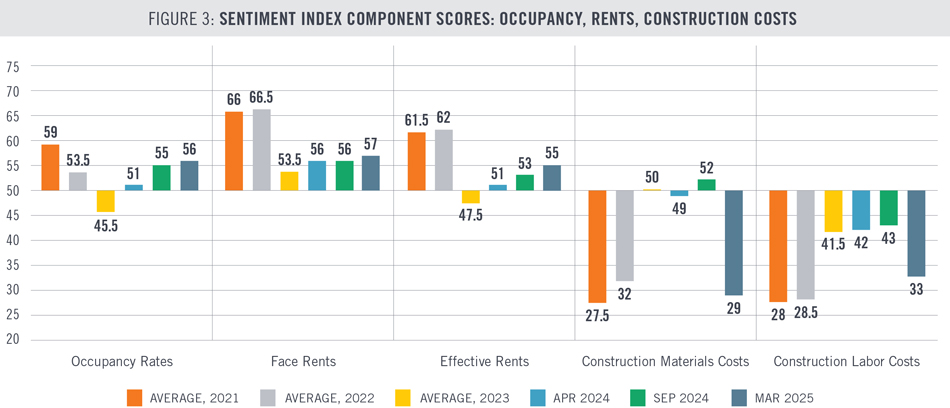
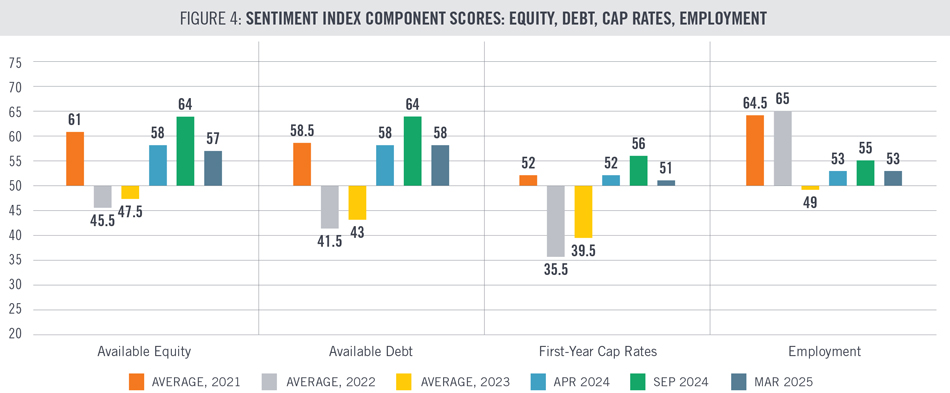
Figures 3 and 4 compare respondent expectations in March 2025 for the individual components that comprise the NAIOP CRE Sentiment Index to expectations in past surveys. For component scores from before 2021, please refer to past editions of this report. Values above 50 represent expectations that a condition will be more favorable for development over the next 12 months (e.g., higher face rents, lower construction labor costs, lower cap rates). Values below 50 represent expectations that a condition will be less favorable during the next 12 months.
The most significant change in sentiment since the September survey is a sharp decline in the outlook for construction material and labor costs. Prior to the current survey, respondents had held a relatively stable outlook for construction material costs since 2023 but had expected moderate increases in labor costs over the same time period. Respondents are now the most pessimistic they have been about both construction labor and material costs since the April 2022 survey.
The outlook for the availability of debt and equity, as well as respondents’ expectations regarding the direction of cap rates, is less optimistic than in the fall but close to levels from April 2024. Respondents’ expectations for employment in their own firms follow the same pattern. Their outlook for property-level performance in the form of occupancy rates and rents has been improving gradually over the last year.
Expectations for Development Conditions
The survey asks developers and building owners to evaluate how important interest rates, local economic conditions, local development approvals processes, environmental regulations and other government regulations will be to their decisions to initiate or continue development projects over the next 12 months (answers are not factored into the NAIOP CRE Sentiment Index). The survey then asks developers how favorable they expect these conditions to be. The results are described in Table 2 on a 100-point scale.
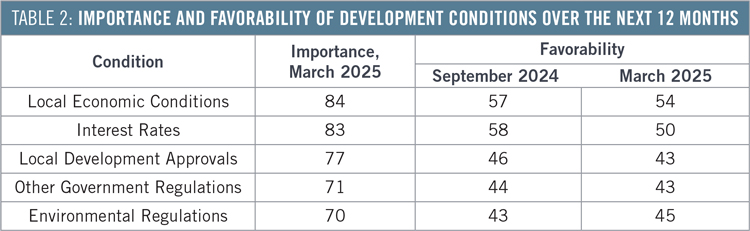
Respondents continue to rank local economic conditions and interest rates as the two most important factors in their development decisions, and there was no change in the order of importance of the remaining factors. They are moderately less optimistic about local economic conditions and now expect interest rates to be neither favorable nor unfavorable to development. Respondents are slightly more pessimistic about local development approvals and other government regulations than in the September survey but slightly less pessimistic about environmental regulations. Regulatory challenges noted in open-ended comments included slowing approval timelines and rent control.
Differences Between Developers and Non-developers
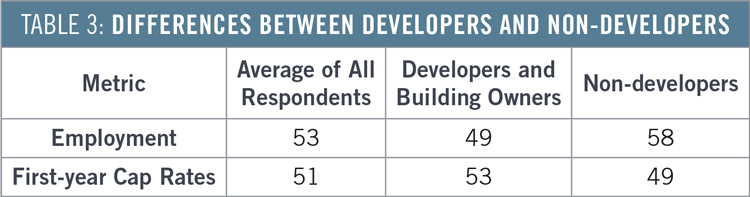
Respondents were asked to identify their primary profession. When comparing the responses of developers and building owners to non-developers, two statistically significant differences emerged related to the conditions that comprise the Sentiment Index (see Table 3). Non-developers indicated a higher likelihood than developers and building owners that their firms would expand employment over the next 12 months. However, developers and building owners were more optimistic than non-developers that first-year cap rates would decline. Notably, developer expectations regarding cap rates are almost unchanged from the September survey (previously a score of 54), while non-developers are now significantly less optimistic than they were in the fall (then a score of 58). It is difficult to explain the difference in outlook on cap rates, as there were no statistically significant differences between the groups in their expectations for interest rates, rents, occupancy or construction costs. Non-developers have been more optimistic than developers about employment in their own firms in the last three editions of the survey, suggesting that their employment is less sensitive to elevated interest rates and construction costs.
Direct From Survey Participants
“I think the commercial real estate market is on the verge of a moderate recovery over the next year. With economic growth picking up and real estate fundamentals strengthening, we should see investment activity bounce back. The office sector, especially in urban areas, might slowly come back to life as companies reassess their space needs. Retail properties seem likely to keep low vacancy rates, thanks to a balanced supply and demand.”
“I believe tenant demand for office will increase over the next twelve months, but vacancy rates will also increase as there are still a number of tenants who have not yet right sized their premises. Landlords will drop rents in order to stabilize their properties in an improving but still competitive market.”
“I believe the industrial market will improve this year. … Many industrial users have performed well over the past few years and now want to own their buildings to gain more control, especially given rising rental rates. … [D]emand for spaces under 100K SF will remain strong, keeping rents on a steady upward trend.”
“This will be an active year in CRE, but until wage costs and building costs come down, I don't think there will be much speculative building.”
“The uncertainty of recent events has us sitting on our hands and afraid of the future. The impact of tariffs is a wild card but will not be good on any level.”
“The unknowns are the impact of tariffs, trade agreements and cost of capital. Those will be the deciding factors, and they are not looking good right now.”
“We anticipate a general slowdown in business for our tenants due to abrupt and uncoordinated disruptions in trade policy, cancellation of investment in growth technologies and infrastructure, and lack of consumer confidence.”
“New startups will slow down because of recession fears, and we’re already seeing tenants back out of lease negotiations because of the uncertainty.”
“Depleted staffing at planning and building departments for local jurisdictions has made timelines and processes for permit review and approval very uncertain and difficult.”
Methodology
The NAIOP CRE Sentiment Index is designed to predict general conditions in the commercial real estate industry over the next 12 months by asking industry professionals to predict conditions for their projects and markets. The NAIOP CRE Sentiment Survey is conducted biannually, in March/April and August/September. The survey is sent to roughly 10,000 NAIOP members in the U.S. who are developers, building owners, building managers, brokers, analysts, consultants, lenders and investors in commercial real estate. It asks questions about jobs, space markets, construction costs, capital markets and other conditions for real estate development. The questions that comprise the Sentiment Index are not equally weighted. Instead, weighting varies based on whether responses to a question are tightly packed or dispersed. Questions with tightly packed responses (meaning there is more consistency among the answers to that question) are more heavily weighted than those with more dispersed responses (which indicate less consistency).
If every participant in the survey selected the most optimistic answer to every question, the index would be 100. Conversely, if all the participants chose the most pessimistic response to every question, the index would be 0. The survey includes questions that evaluate sentiment about conditions that are not included in the composite score but are measured separately on a 100-point scale.
A cross-tabulation of the March survey results by respondent profession revealed two questions in which differences between responses were statistically significant. Differences that were not statistically significant are not reported in this analysis.
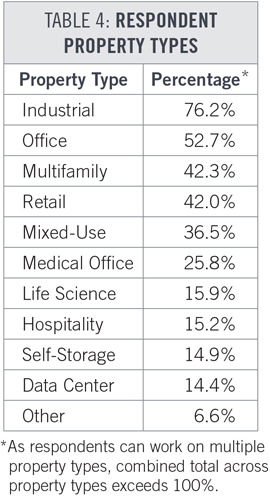
A total of 395 respondents from 289 distinct companies participated in this survey. A breakdown of the property types that respondents work on is provided in Table 4.
A regional breakdown shows that 50.6% of respondents are active in the West, 39.0% are active in the South, 31.9% are active in the East and 27.8% are active in the Midwest.
Survey participants receive a summary of results showing the percentage breakdown of responses to each question after the survey closes. This report is released to all NAIOP members and the public three to four weeks later. Survey responses for this index were gathered between March 12 and March 20. The response rate for this survey was 4.1%, and the margin of error for the composite index score was 4.9%.
The statistical methodology for the Sentiment Index was originally developed by Tom Hamilton, Ph.D., MAI, CCIM, CRE, the Gerald Fogelson Distinguished Chair of Real Estate in the Chicago School of Real Estate at Roosevelt University. The survey data was collected by NAIOP, and the survey questions were created, refined and finalized between 2014 and 2023 with the assistance of several NAIOP Distinguished Fellows. NAIOP Senior Research Director Shawn Moura, Ph.D., authored the current edition of the survey and this summary analysis. For questions about the CRE Sentiment Index, please contact Shawn at moura@naiop.org.
Media Inquiries
Please contact Kathryn Hamilton, vice president for marketing and communications, at hamilton@naiop.org.
